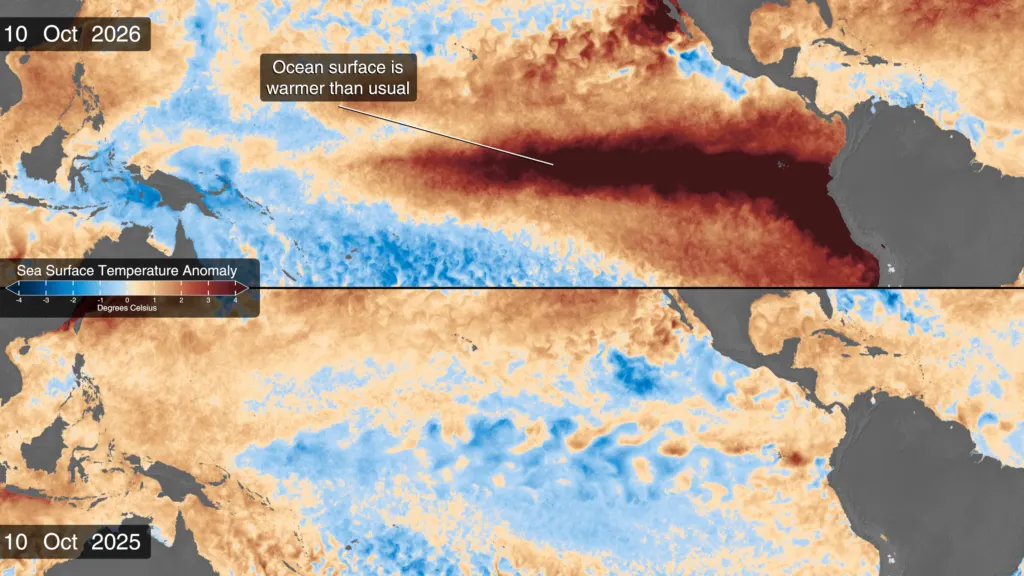
The tropical Pacific is running a full degree warmer than it did at the same point of the last El Niño. In its October 8, 2026, ENSO discussion, the US Climate Prediction Center put the Niño-3.4 index at +2.1°C, against +1.5°C in its October 2023 discussion, and parts of the eastern equatorial Pacific were more than 4°C above normal.
The agency now gives an 83% chance that the October to December average will top every El Niño on its books since 1950. Three years ago, its forecasters rated the odds of a “historically strong” event at 3 in 10.
Same month, two El Niños
The Climate Prediction Center, part of NOAA’s National Weather Service, publishes one diagnostic discussion a month. Setting the two October releases side by side gives a clean comparison, since both describe September conditions in the ocean.
- Niño-3.4 (central Pacific): +1.5°C in 2023, +2.1°C in 2026, a gap of 0.6°C.
- Niño-3 (east-central Pacific): +1.9°C in 2023, +3.0°C in 2026, a gap of 1.1°C.
- Niño-1+2 (off South America): +2.6°C in 2023, +3.9°C in 2026, a gap of 1.3°C.
- Status both years: an official El Niño Advisory.
Our tally from those figures: the 2026 event is ahead in all three regions, and the lead grows the farther east you look, from 0.6°C in the middle of the basin to 1.3°C near the coast of Ecuador and Peru.
Below the surface the picture is similar. In October 2023, the center said subsurface warmth had decreased while staying above average. This October it reported temperatures more than 10°C above normal at depth in the eastern Pacific and a deeper-than-average thermocline, the boundary between warm surface water and colder water below.
What the forecasters expect
In 2023 the center favored at least a “strong” event, with a 75 to 85% chance through November to January, and expected El Niño to last into spring 2024. That event went on to peak in December 2023 as one of the five strongest on record, according to the summary of the 2023–2024 El Niño event, and faded in April 2024.
The 2026 outlook goes further. It describes “a strong-to-very strong El Niño likely through January-March 2027,” and lists a 54% chance of a record-strength season for September to November, 83% for October to December and 70% for November to January. The center defines record strength here as a three-month value of +2.5°C or more.
Limits of the comparison
The two years are not measured on exactly the same yardstick. NOAA now uses the Relative Oceanic Niño Index, or RONI, for official monitoring, as noted on the Climate Prediction Center’s index page. RONI adjusts for the warming of the whole tropical ocean, so a +2.5°C RONI threshold is not the same test as the 2023 rule of thumb, which called a seasonal Niño-3.4 average of 2.0°C or more historically strong.
The forecasters also caution that a stronger event raises the odds of typical El Niño weather patterns without guaranteeing them in any one place. Seasonal outlooks, not the index alone, give those odds region by region.
For more on how Pacific water shifts play out locally, see our report on Panama’s failed winter upwelling in 2025 and our look at almanac forecasts against NOAA’s November outlook.
The next ENSO diagnostic discussion is scheduled for November 12, 2026, and will show whether the index kept climbing through October.
Further reading
Image: NASA Scientific Visualization Studio, Public domain via Wikimedia Commons
This article was produced with AI assistance and reviewed by our Editorial Desk. How we work.